Grafana Labs' fourth annual observability survey (March 2026) found OpenTelemetry in broad use across metrics (57%), traces (50%) and logs (48%). Those numbers sound healthy until you ask a harder question: how many of those organizations can follow a single customer transaction from an API gateway, through a Kafka topic, into a Camunda workflow, out to an LLM provider, and back? The honest answer, for most, is no.
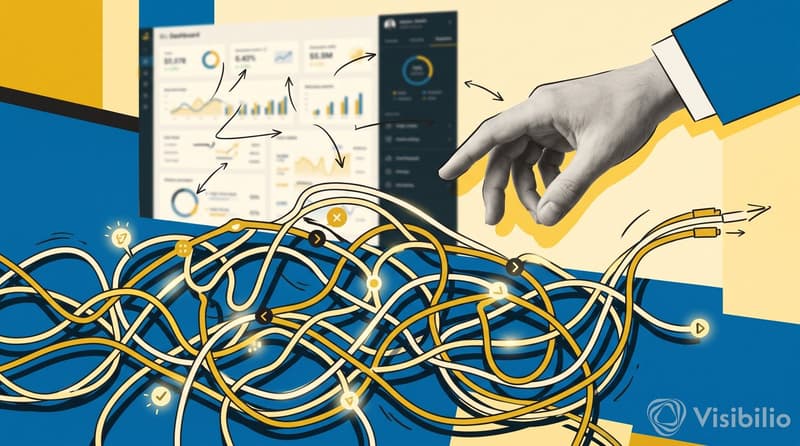
"We use tracing" usually means partial instrumentation. HTTP services are covered. The queue behind them is a black hole. The BPM engine running a long-lived approval process? Disconnected. The AI call that scores a document or generates a summary? Flat logs, no parent span, no link to the originating business event. That gap between "we trace" and "we correlate" is where incidents get expensive and audits get uncomfortable.
W3C Trace Context gives you the lingua franca: a traceparent header (and an optional tracestate) that standardizes how trace context crosses service boundaries. The protocol is simple; the discipline around it is not.
The most common mistake I see in enterprise estates is also the most destructive: copying an incoming traceparent unchanged into every downstream request. That feels intuitive (same trace, same header, right?) but it breaks parent-child relationships. Every downstream span hangs off the original caller, so it shows up as a sibling of the service that actually dispatched it instead of its child. Your trace tree becomes a trace pancake: useless for root cause analysis.
Correct propagation follows three steps. Extract the incoming context. Create a span for the current operation. Inject a new outbound context that carries the current span as the parent. OpenTelemetry's propagation model codifies this: inject into a carrier on the way out, extract from the carrier on the way in. For HTTP, the carrier is a header. For messaging, it's message metadata. For AI calls, it's whatever your gateway or SDK lets you attach. The principle doesn't change, but the carrier does.
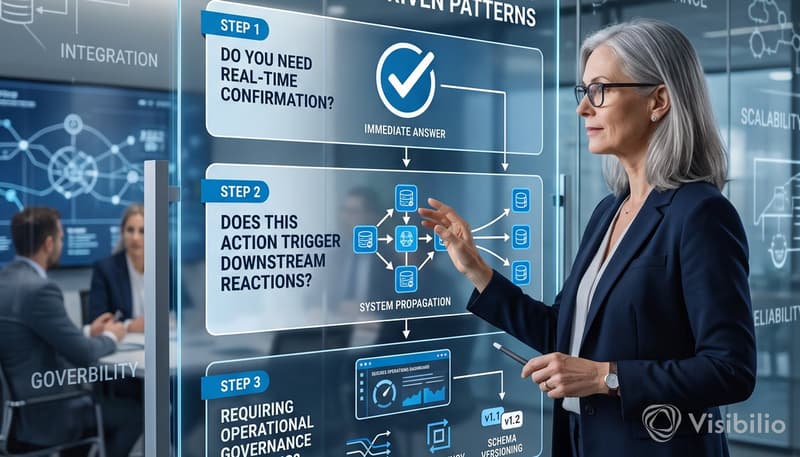
Kafka, RabbitMQ, SQS: the moment you drop a message onto a broker, you've introduced delays, retries, redelivery, fan-out, fan-in and batching. Each of those lifecycle events can silently sever a trace if you haven't designed a propagation policy. (If you are still deciding where a queue belongs at all, start with the three questions for API vs. event-driven architecture.)
Injecting trace context into message headers is the baseline. Without it, consumer work shows up as disconnected, orphaned traces with no link to the producing transaction. But header injection alone doesn't settle the shape of the trace. The OpenTelemetry messaging semantic conventions make span links the default: the span that processes a message should link to that message's creation context, and using the creation context as the parent is allowed only when a single message is processed. The reason is simple. A span has one parent, so if five producers feed one consumer batch, only links can show all five. Links are the one trace structure that stays consistent across single messages, batches, retries and redelivery.
The practical rule I use: one message, one producer, one consumer, handled promptly, may keep the producer as its parent if that makes the waterfall easier to read. Batches, fan-in, delayed retries and redelivery get their own spans that link back to each message's creation context. Decide this policy before you instrument; retrofitting it after a production incident is painful and usually incomplete. Retries and dead-letter queues have design rules of their own, covered in our guide to timeouts, retries, idempotency and DLQs. The trace should show every attempt, not just the last one.
A workflow engine like Camunda introduces a time dimension that HTTP-centric tracing wasn't built for. A process instance can outlive the initiating request by hours, days, or weeks. Timers fire. Human tasks wait. Job workers pick up work asynchronously. The in-memory trace context from the original HTTP call is long gone.
The temptation is to use the process instance ID or a business key (order number, case ID) as the correlation mechanism and call it done. Those identifiers are useful for operational lookup and customer support, but they are not trace context. They don't carry span parentage, they don't flow through OpenTelemetry propagators, and they don't show up in your tracing backend's dependency graph.
What works: persist the trace context with the process. When the process starts, store the initiating traceparent as a process variable. When a job worker picks up a task, start a new trace for that execution, attach the process instance ID as a span attribute, and add a span link to the stored context (or to the previous task's trace, if you store that too). This gives you two complementary views: the business-level correlation via process instance ID, and the technical trace graph via linked spans. Neither replaces the other.
As Elastic's observability team noted, tracing model and tool calls as first-class spans is the difference between "the AI did something" and "the AI did this, in this workflow step, for this customer transaction, and here's the latency breakdown." Flat AI logs that record prompt-in, response-out, with no parent span and no trace ID, can't be tied back to the business event that triggered them.
If your AI calls go through a gateway (and in a governed environment, they should; we looked at Cloudflare AI Gateway as one such control point), the call to that gateway is the injection point. Propagate trace context into the gateway request, and let your SDK or gateway client create a child span for the model invocation. The OpenTelemetry GenAI semantic conventions name its attributes: gen_ai.request.model, gen_ai.usage.input_tokens, gen_ai.usage.output_tokens, gen_ai.provider.name. They are still marked as in development, but they give every team the same field names. Prompt and response content (gen_ai.input.messages, gen_ai.output.messages) is opt-in, so the span stays queryable without your tracing backend becoming a copy of every prompt. Privacy-safe, auditable and connected to the originating transaction.
For agentic patterns where one model call triggers tool use which triggers another model call: each step is a span, each span carries the trace. The agent's decision graph becomes visible in the same trace waterfall as the API call and the queue message that started everything. It also helps with record-keeping: for high-risk AI systems, the EU AI Act (Article 12) requires the automatic recording of events over the system's lifetime. A trace that ties each model call to its process step and transaction is a solid basis for those records, without putting prompts in the trace store.
Five controls I'd want in place before any team claims end-to-end trace correlation:
- Propagation verification per boundary type. HTTP, messaging, BPM task dispatch, AI gateway. Test each one. A trace that crosses three boundaries and loses context at the second is worse than no tracing, because it creates false confidence.
- Explicit async tracing policy. Document when a consumer keeps the producer as its parent and when it links. Make the decision visible in code reviews, not buried in library defaults.
- Business identity as attribute, not substitute. Order IDs, case numbers, and process instance IDs belong as span attributes. They complement trace context; they don't replace it.
- AI span design. Model calls get their own spans with the GenAI attribute names. No flat logs. No "we'll add tracing later."
- Incoming trace context treated as untrusted input. W3C Trace Context says an invalid traceparent is ignored and a new trace starts, and it describes restarting the trace at the front gate of a secure network. Don't let an outside caller decide your sampling either: a forced sampled flag is a cheap way to overload your tracing.
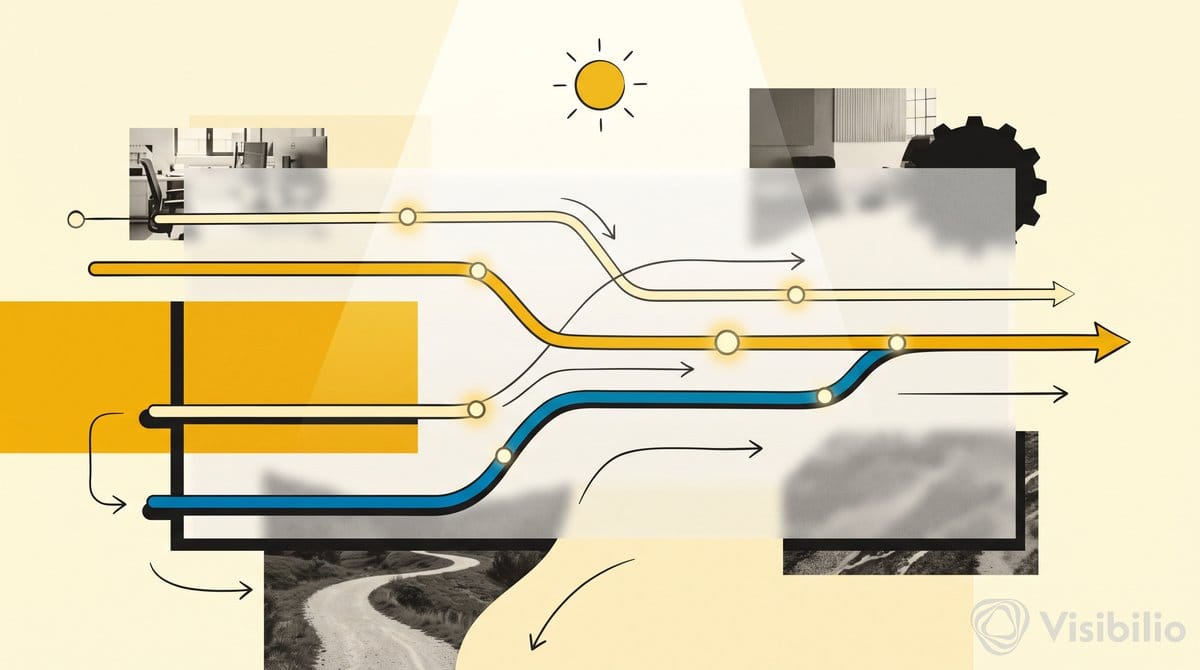
Pick one real transaction this week that crosses all four boundaries. Follow it from the API call to the queue, the workflow task and the model call, and write down every place where the trace breaks. Each break is a carrier without a propagation path. Fix them in the order the transaction meets them, then run the same walk again after the next release.